Dashboard Structure
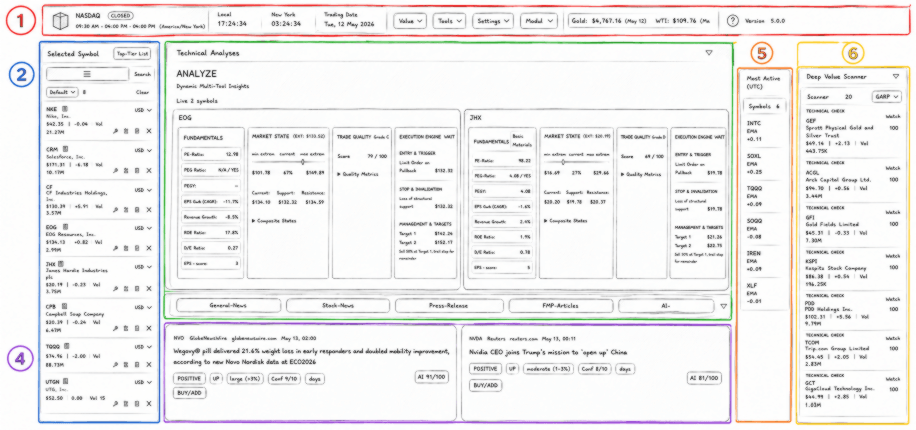
The Neo dashboard is divided into six main zones:
| Area | Purpose | Link |
|---|---|---|
| 1. Top Bar | Market/session overview and global controls | Top Bar |
| 2. Left Sidebar | Symbol management and watchlists | Left Sidebar |
| 3. Main Analysis Area | Deep analysis for selected symbols | Analysis |
| 4. News & AI Panel | AI-evaluated news and market events | News |
| 5. Most Active Panel | most traded symbols | News |
| 6. Deep Value Scanner | Opportunity scanners and market filters | News |